|
|
Menu and Toolbar Interface Reference
 Assessment Assessment

Assessment allows various market assessments to be conducted on the data entered into Salesmatrix.
- Days between Sales - Customers
Ranks Customers in 6 categories based on the number of days between sales over a 12 month period. In the above example, the results show that there were 82 (34.3%) out of 239 customers who spent more than the threshold of $100 in the target category (every 14 days or less) in the period Year to Feb 01.
- Days between Sales - Products
Ranks Products in 6 categories based on the number of days between sales over a 12 month period.
- Customers to Products Cross-Sell
Ranks Customers in 6 categories based on the number of individual products purchased over a 12 month period.
- Retention
Ranks Customers in 7 categories based on their purchasing pattern over the last chosen (3 or 6 month) period.
- Gained
Customers who have not purchased at all in the past and who have purchased amounts in excess of the threshold in the chosen time period.
- Regained
Customers who have purchased in the past, but have been dormant, and have been reactivated in the chosen period.
- Retained - Increased
Customers who have been active in the chosen period and have increased their spending based on prior periods activity.
- Retained - Decreased
Customers who have been active in the chosen period but have decreased their spending based on prior periods activity.
- Lost
Customers who have not purchased over the threshold in the chosen period but were active in the prior period.
- Lost Previously
Customers who have not purchased over the
threshold in the chosen period and were also inactive in prior
period(s).

| Yr to June 07 |
|
| |
Jul-Dec 06 |
Jan-Jun 06 |
Jul-Dec 07 |
Jan-Jun 07 |
| Customer 1 |
|
|
|
500 |
| Customer 2 |
400 |
|
|
1000 |
| Customer 3 |
400 |
500 |
750 |
1000 |
| Customer 4 |
1000 |
|
|
|
| Customer 5 |
1000 |
1100 |
400 |
|
|
| |
| Gained |
| Regained |
| Retained Increase |
| Lost Previously |
| Lost |
|
Sales Value Threshold 100 Last 6 months.
- Customer Margin Percentage
This assessment groups customers
together according to their margin levels. Set the levels appropriate to your business and
selecting a Customers Category at the bottom of the screen and clicking
Calculate will categorise the customers that fall into each level.

Changing the Threshold Value can alter the results returned. For example, if the Threshold Value were raised to 500, Customer 2 in the above example would be classified as gained and Customer 5 will be classified as Lost Previously.
Options
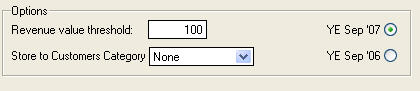
- Sales Value Threshold
Sets the minimum value used as a threshold in each of the assessments
- Store to Customer/Product Category
When this is checked this will transfer the results from the assessment to the category chosen in either the customer or product aspect. NOTE: This will overwrite the current category in the dataset. Be sure to save a category set before performing this operation if you wish to retain the current categories. If you are not already in an appropriate view (eg Customers by Period), you will need to change to an applicable view on the grid, to view the new category created.
- Periods choice
Allows the user to choose which period the
assessment is performed on.
Copyright
|