|
|
Menu and Toolbar Interface Reference
 Options Options
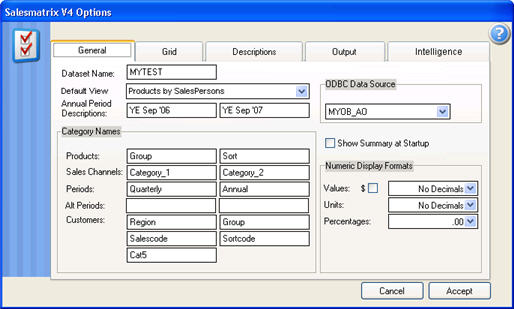
Choosing the Options button from the Toolbar will launch this screen, the first of four screen pages enabling modification to the functionality and appearance of Salesmatrix.
- Dataset name
The name given to the current dataset
- Default View
The first view of the data grid that is shown after the dataset is opened, or the user quits from Quadrants mode
- Annual Period Description
The names given to the two Annual periods within the current dataset
- Category Names
The names given to each of the category sets for each dimension of Sales Matrix. Note that the Customer aspect has five categories.
- ODBC Data Source
The default ODBC data source. This can be changed at import time.
- Show Summary at Start-up
An option to turn of the summary screen from showing as a dataset is opened for the first time.
- Numeric Display formats
Allows the user to change the significant numbers displayed in the Salesmatrix grids.
Grid tab
- Grid Font
Allows the user to change the fonts styles and text colours displayed on the grid.
- Grid Line Types
Allows the user to change the line and cell styles displayed on the grid.
- Dimension Colours
Allows the user to change the background colours used to identify what dimensions of the Salesmatrix you are viewing. Double click on coloured areas to select a new colour from a fixed palette. It is recommended that lighter colours are used so as to enable a good contrast with the text printed in the foreground.
- Grand Total remains at bottom of grid when sorting
By default the Grand Total will remain at the bottom of the grid when a column
is sorted from the highest to lowest down the grid. In the case of large grids
it can be more practical to have the total column sort to the top of the grid.
Uncheck this option to have the total row sort to the top.
- Launch Web Browser when Grid output to HTML
When this option is checked the default web browser will launch following
the creation of an HTML file.
Description tab
Allows the user to change the customary descriptions displayed in the menus. Examples of changes could be from 'Revenue' to 'Sales' or 'Margin' to 'Profit' etc
Output tab
- Output options
Allows the user to choose between Printers or File Formats for output. If a file output type is chosen (PDF, RTF, MS Word) the default directory for this output to go to is also available to be chosen.
- Default Directories
Data Directory: Allows the user to specify the default location of the Salesmatrix dataset directory
Scripts Directory: Specifies the default directory used by Salesmatrix to store the scripts used to define import rules. This may need to be altered by users upgrading from previous versions.
- Email Options
Outlook Express: Sends output to Outlook Express with grid data as an attachment.
Outlook: Sends output to MS Outlook with grid data included as HTML output.
SMTP Direct: Sends output direct to a mail server as specified in the adjacent box.
Intelligence tab
- Intelligence Centres
Use Current Date: By default uses the current date to measure the time
since products were sold, customers have purchased etc. When this is
switched off, the routine uses the monthly period settings to determine time
gap since last purchase/sale etc.
Max Items Shown: Sets a maximum of values shown in the grid for last
sales, top products etc.
- Market Basket Settings
Confidence Level: Sets the minimum confidence level for items to be
acceptable for association in the intelligence centre market basket
reports.
Minimum Significant Transactions: Sets the minimum number of
transactions acceptable for associated products in the intelligence centre
market basket reports
Percentage of baskets displayed in Grid: Sets the number of basket
combinations that are displayed in the Market Basket Grid. The higher the
number the longer the grid will take to calculate and will show combinations
that will have a lower significance.
Basket Tree Show __ percent: Sets the percentage of the number of
baskets that are displayed in the basket tree display. The higher the value,
the more items in the tree and the longer to calculate all baskets
combinations.
Basket Tree top __ baskets: If the percentage set above is not large,
the basket tree display will show this minimum number of basket
combinations.
- Traffic Lights
Allows the user to change the colours shown when traffic lights are displayed on the grid. Double click on coloured areas to select a new colour from a fixed palette.
Std Deviation Level: Sends output to Outlook Express with grid data as an attachment.
Show Traffic Lights in Totals: Sends output to Outlook Express with grid data as an attachment.
Copyright
|